Business management is carried out using indicators and target values, monitoring the state of the process by which businesses use statistical methods and technologies for analyzing historical data in order to gain new insight and improve strategic decision-making.
Business analytics allows you to measure the main indicators of the store's operating activity, turning the numbers into graphs that are understandable for management analysis. a data management solution and business intelligence subset, refers to the use of methodologies such as data mining, predictive analytics, and statistical analysis in order to analyze and transform data into useful information.
E-Shop Analytics
All-in-one solution to track your eCommerce KPIs
We are not collecting any kind of your data, not selling or leasing your information to any third party.
E-Shop Analytics (ESA) is fully integrated e-shop analytics and statistics dashboards with major Ecommerce metrics that specifically help you to measure and lead to success in your online business.
E-Shop Analytics has unique built-in planning tools, since online selling is an on-going process, you need a Planning system to manage day-to-day operations.
Successful eCommerce business makes decisions based on quantifiable measures that are used to track store’s performance:
- Track eCommerce metrics: from cost, revenue, income and to shopping cart abandonment, to delivery statuses, all of your major Indicators are easy to measure and track
- Optimize business: our e-shop analytics tools will help you to boost online sales by using Sales Plan modeling, cost and price control.
- Use analytics interfaces: our dashboards combine data from your site all-in-one place, so you can build reports without developers and without knowledge of SQL.
Steps required to setup the E-Shop Analytics are listed below:
- Find X-Cart App Store.
- Select Kinvasoft addon E-Shop Analytics
- Log into X-Cart
- Choose E-Shop Analytics and add to your Cart
- Set up your app E-Shop Analytics
- Set up your e-shop parameters
An example of how to set up an additional E-Shop Analytics parameters see below:
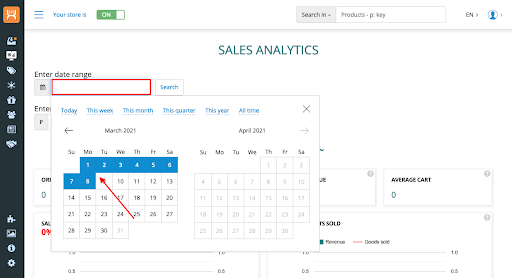
Step 1 – check you date range
Make sure that you have the right date range for your Sales plan. Select a date dropdown calendar, then click the "Search" button.
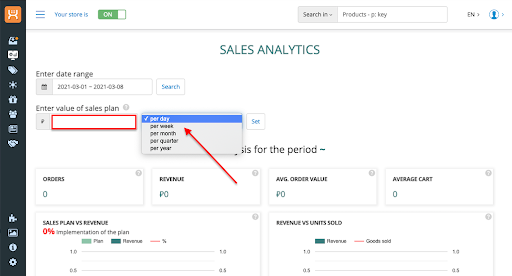
Step 2 – customize your Sales plan
Enter a value of your Sales plan and select the period in the drop-down list, then click the «Set» button.
Step 3 – configure the Dashboards
Enter the type of your currency,
go to Store setup >> Localization >> Currency

Keep checkbox “unchecked” to hide trailing zeros in fractional part

Step 4 – select what type of eCommerce metrics you need
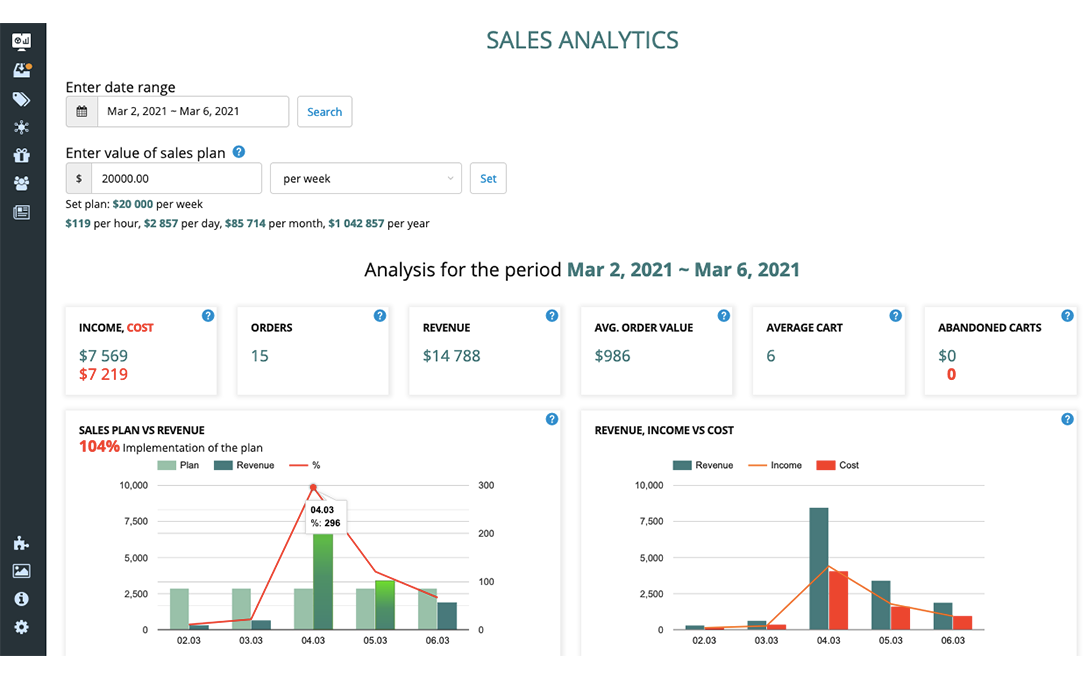
The next step is to select quantifiable measures that are used to track your store’s performance
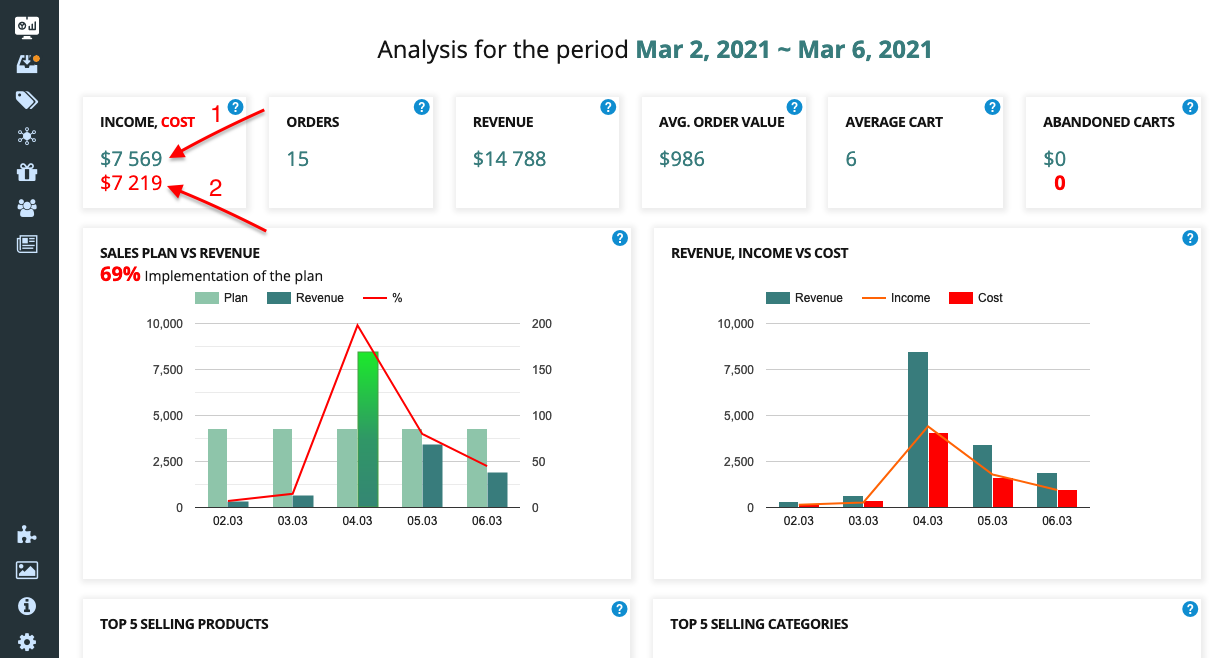
Revenue
Revenue is the sum of the Orders with the "Paid" status (paid sale transactions) within the selected time period for your shop, in your currency

Orders & Average Order Value
Orders is the number of client’s Orders with the status "Paid" (paid orders). Average Order Value is Revenue divided by the number of paid orders.
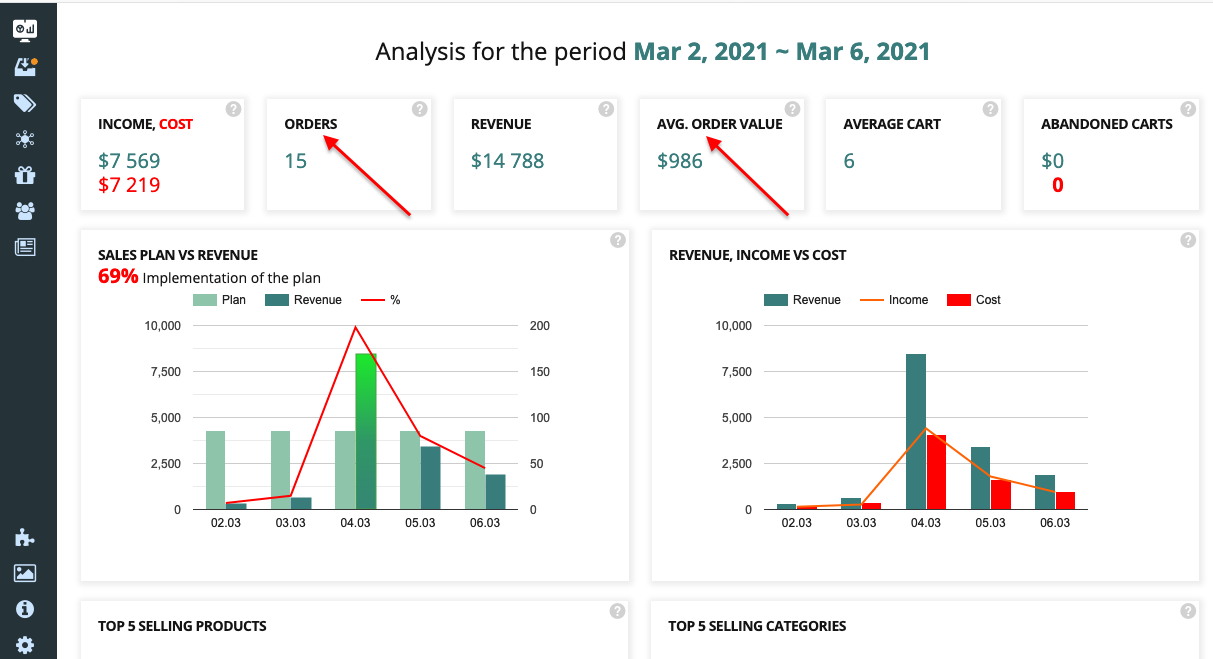
Income & Cost (Expenses)*
Income and Cost (Expenses) for the selected period, represented with two digits:
- Income sum in currency calculated by the formula: the number of goods sold for the period with the status "Paid" minus by the number of total Costs, for the selected period;
- Cost (Expenses) the sum in currency (marked in red color).
* - need to setup module for free:
https://market.x-cart.com/addons/cost-price.html
Average Cart & Abandoned Carts*
Average Cart is the average number of goods sold in the Сart, calculated by the formula: the number of goods sold for the period with the status "Paid" divided by the number of orders with the status "Paid", for selected period.
Abandoned Carts is represented with two digits:
- total sum of abandoned carts in currency;
- abandoned carts in units (marked in red color).

* - need to setup module for free:
https://market.x-cart.com/addons/abandoned-cart-reminder.html
Sales Plan Vs Revenue
The diagram shows:
- percent of Sales plan Implementation (marked in red color) for all selected period; & you can choose any period when you hover the cursor on the diagram;
- performance of the Sales plan vs Sales Revenue, in the store currency for the selected period.
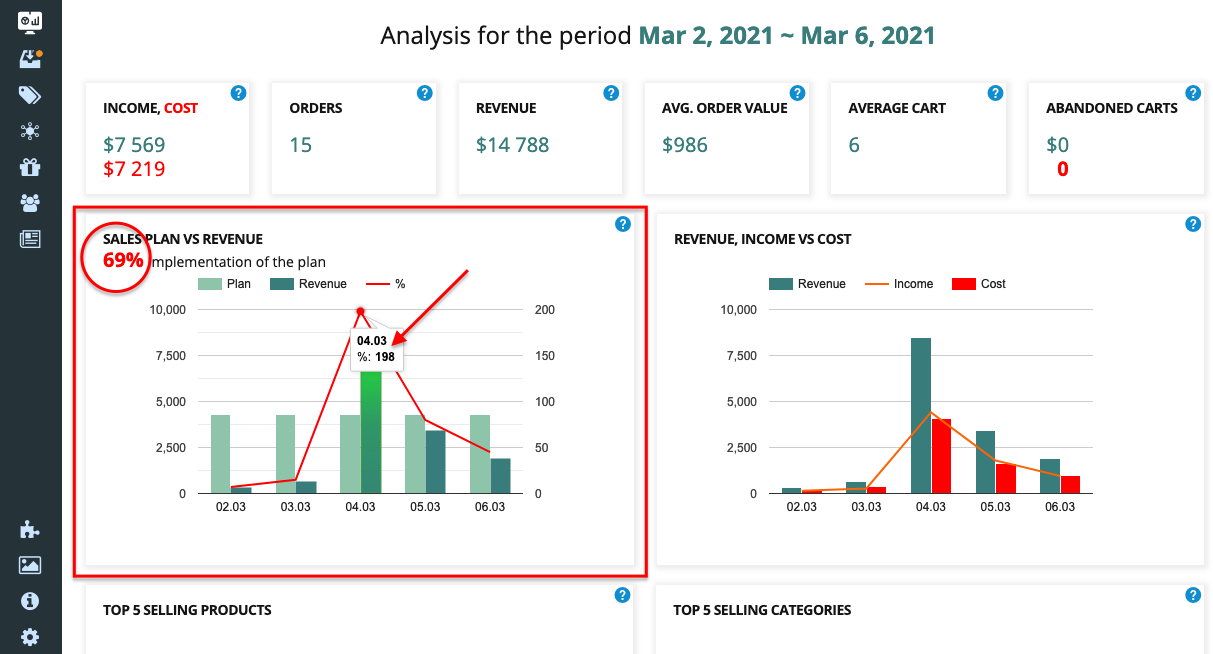
Revenue, Income Vs Cost
The diagram shows Revenue, Cost and Income (marked in red color), you can choose any period when you hover the cursor on the diagram.

TOP 5 Best-selling Products
The diagram shows the 5 best-selling goods in units, and the amount in the store currency when hovering the cursor. Point your mouse over the chart to view information on the product.

TOP 5 Best-selling Categories
The diagram shows the 5 best-selling product categories. Number in units, and amount in currency when hovering the cursor. Point your mouse over the chart to view the information by category

Delivery Status
The diagram shows the Delivery statuses and the number of orders in the store currency in status stores for the selected period, hovering the cursor over the chart to view more info.
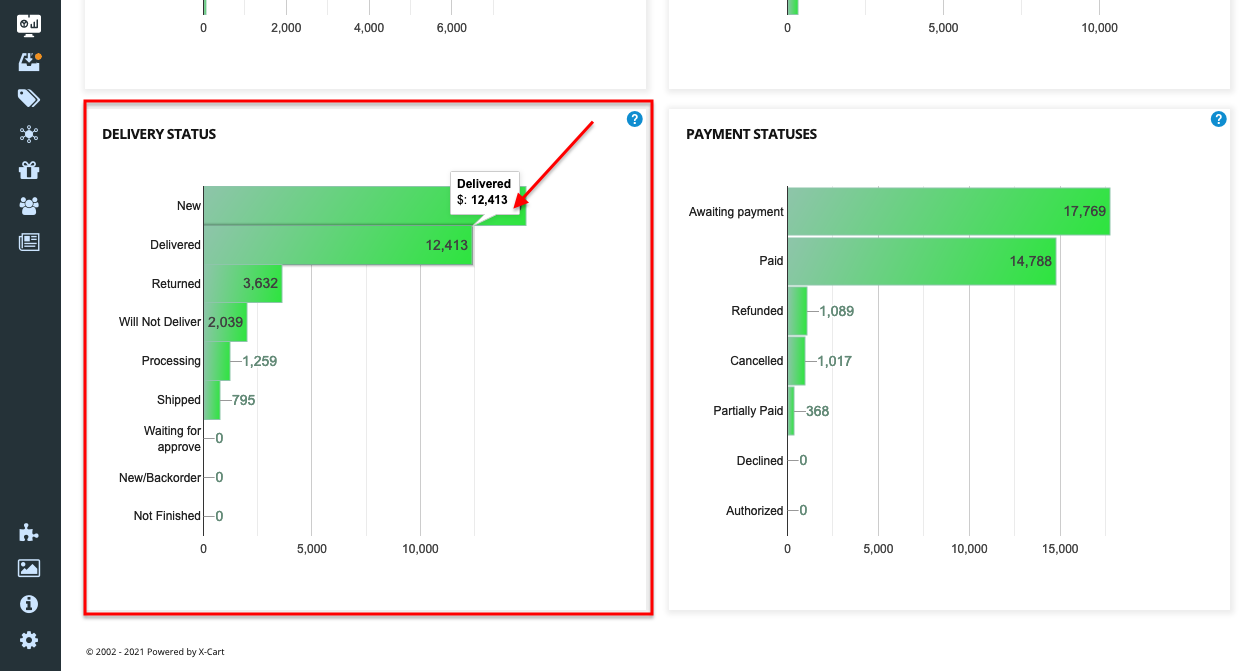
Payment Status
The diagram shows the Payment statuses and the number of orders in the store currency for the selected period. Please, hovering the cursor over the chart to view more information.
